
Malesuada amet neque diam arcu. Mauris pharetra eu ornare lorem porta nibh condimentum pellentesque.

Triton Digital has released its monthly digital audio Top 20 Ranker for March 2015. Le classement est une liste des meilleures stations audio et réseaux numériques définie par la plateforme de mesure d'audience Webcast Metrics®.
All Measured Clients
All measured clients in March 2015 showed 4 260 886,00 Average Active Sessions (AAS) within the Domestic U.S. during the Monday-Friday 6:0 0AM-8:00PM (M-F 6A-8P) daypart, and 3 603 593,00 AAS during the Monday-Sunday 6:00AM-Midnight (M-Su 6A-Mid) daypart.
Taking a Closer Look
March 2015 showed positive growth in both dayparts when compared to March 2014. AAS within the Domestic U.S. grew by 40,80 percent (M-F 6A-8P) and 45,80 percent (M-Su 6A-Mid).
Both Pureplay and Terrestrial broadcasters showed positive growth when compared to the beginning of 2015. AAS (M-F 6A-8P) within the Domestic U.S. grew by 9,60 percent for Pureplays and 9,20 percent for Terrestrials.
Listening by Market
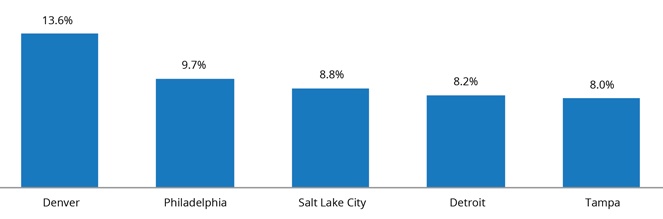
Looking at the top 20 markets, Denver showed the largest listening gain with a 13,60 percent increase in AAS (M-F 6A-8P), followed by Philadelphia, Salt Lake City, Detroit, and Tampa.
Audio Consumption
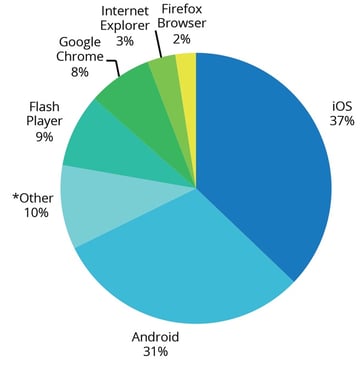
During the M-F 6A-8P daypart, 37 percent of listening took place on an iOS device, followed by Android at 31 percent, Flash Player at 9 percent, and Google Chrome at 8 percent.
Mobile Continues to Rise
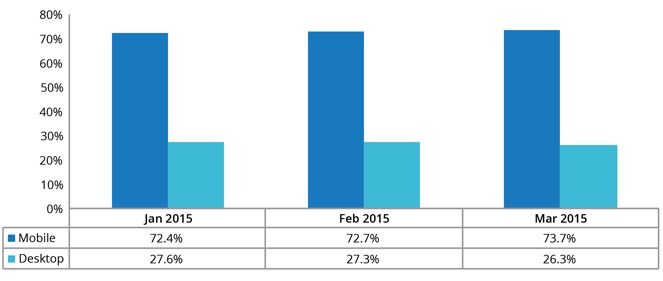
March mobile consumption during the M-F 6A-8P daypart represented 73,70 percent of total listening, compared to 26,30 percent for desktop. Trending for the first three months of 2015 is charted below.
Envie de débloquer de nouveaux revenus et de simplifier l'achat de publicités ?
Contactez-nous