
Malesuada amet neque diam arcu. Mauris pharetra eu ornare lorem porta nibh condimentum pellentesque.
Triton Digital has released its monthly digital audio Top 20 Ranker for July 2016. Le classement est une liste des meilleures stations audio et réseaux numériques définie par la plateforme de mesure d'audience Webcast Metrics®.
Our review of the July 2016 data uncovered several interesting stats about listening growth and audience trends. Check them out below.
Total Listening in July 2016
All measured clients within the Domestic U.S. reported a total of 4 571 188,00 Average Active Sessions (AAS) during the Monday-Friday 6:00AM-8:00PM daypart, and 3 825 487,00 AAS during the Monday-Sunday 6:00AM-Midnight daypart.
Fourth of July Effect
Overall domestic AAS declined 7,70 percent during the week of the Fourth of July (M-F 6A-8P) when compared to the three weeks following. Mobile listening declined 4,60 percent while desktop dropped by 16,00 percent. PurePlay listening was down 6,50 percent while broadcast streams declined by 16,60 percent.
In comparison, overall non-US based listening declined 0,60 percent during the week of the Fourth of July (M-F 6A-8P) when compared to the three weeks following. Mobile listening declined 1,30 percent while desktop dropped by 0,70 percent. PurePlay listening was down 0,50 percent while broadcast streams declined by 1,50 percent.
Year-Over-Year Listening (July 2016 vs. July 2015)
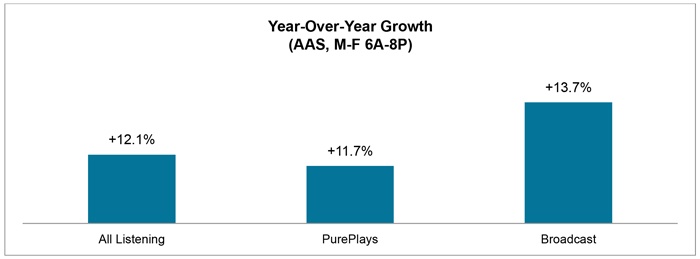
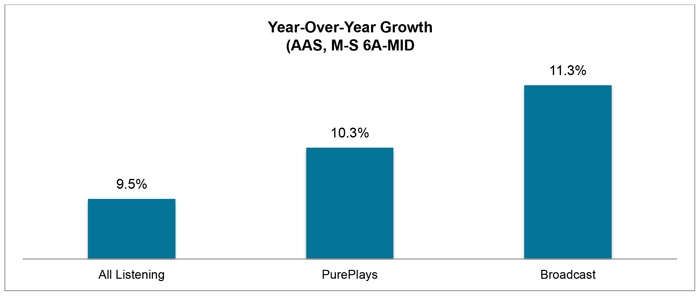
Overall streaming has seen steady growth when compared to July 2015. Both Pureplays and AM/FM Broadcasters showed positive growth during the Monday-Friday 6:00AM-8:00PM daypart and the Monday-Sunday 6:00AM-Midnight daypart.
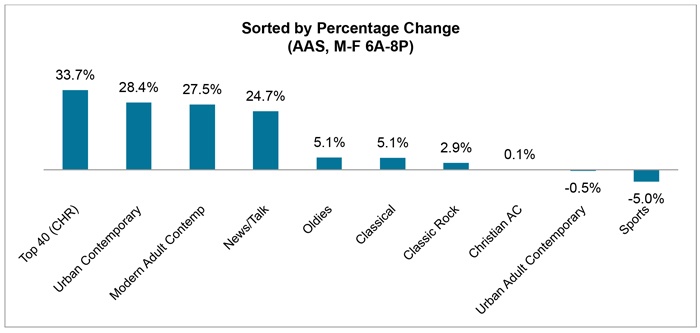
Top 10 Formats (July 2016 vs. June 2016)
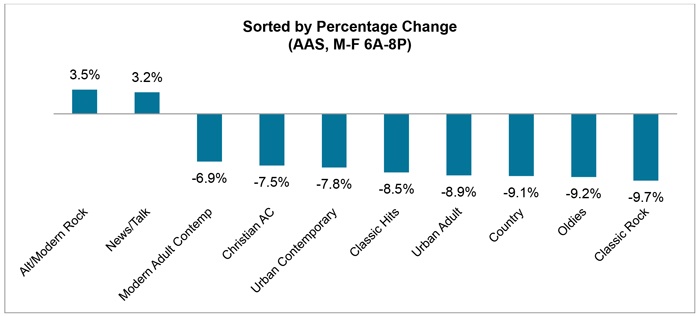
Top 10 Formats (July 2016 vs. July 2015)
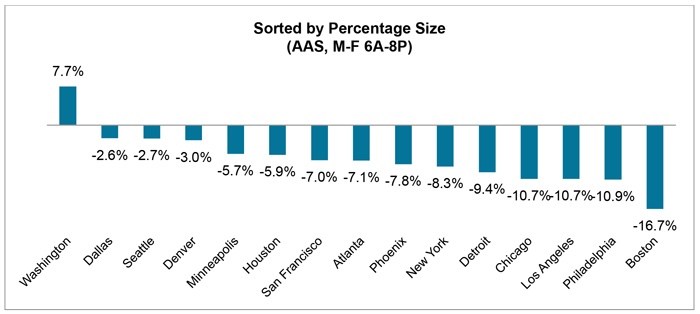
Top 20 Markets (July 2016 vs. June 2016)
Top Devices in July 2016
41 % of listening took place on an iOS device, followed by Android at 31 %, Google Chrome at 8 % and Flash Player at 8 %.
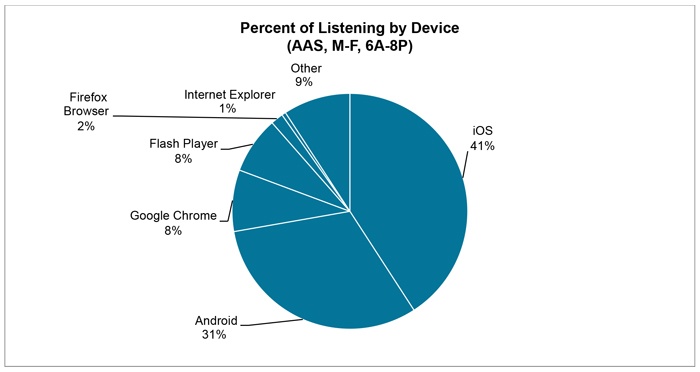
*The category ‘Other’ consists of devices, types and browsers that are less than 2 % of total audio consumption and audio consumption that cannot be classified
Average Time Spent Listening for July 2016
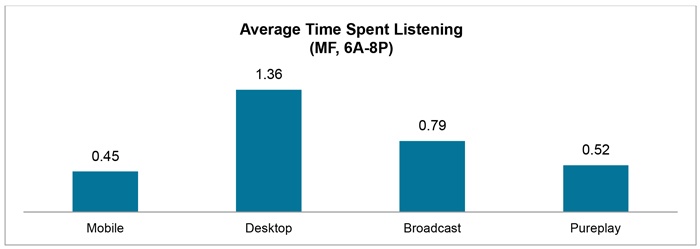
ATSL = The average number of hours for each session with a duration of at least one minute in total and any duration within the reported time period.
Digital Audio Trends and Insights represent all clients measured by Triton.
Envie de débloquer de nouveaux revenus et de simplifier l'achat de publicités ?
Contactez-nous